13 Important WooCommerce Metrics and KPIs


WooCommerce is a leading platform that provides hundreds of metrics to measure the success or setbacks of an eCommerce business over time.
Given the vast array of metrics available, it may be confusing (or even mind-boggling) for a client to quickly and clearly understand their eCommerce business performance.
Narrowing down and monitoring these key metrics helps to track and stay in tune with business objectives. It will also help you to understand how visitors interact with your WooCommerce site so you can improve conversion rates and grow your business over time.
This blog post will cover the critical WooCommerce metrics that your agency should be measuring. We’ll also see how easy it is to create a report with AgencyAnalytics.
Why Are KPIs Important for WooCommerce Businesses?
The end goal of any WooCommerce business is to thrive or make a profit. It takes strategic decisions to stay on top of the game in the dynamic and competitive eCommerce environment. And to stay afloat and one step ahead of the competition, you’ll need to make decisions backed up by the most relevant, airtight data.
Not all metrics tie into your long-term goals or strategic objectives, so you should only focus on concrete data that directly affects or impacts your business.
But how do you determine what’s worth tracking and what’s surface-level data? That’s where distinguishing between metrics and Key Performance Indicators (KPIs) comes in.
What’s the Difference Between KPIs and Business Metrics?
As we’ve mentioned earlier, KPIs are a subgroup of metrics. In fact, all KPIs are metrics, but not all metrics are KPIs. To make this distinction easier, think of metrics as the overall umbrella that houses KPIs.
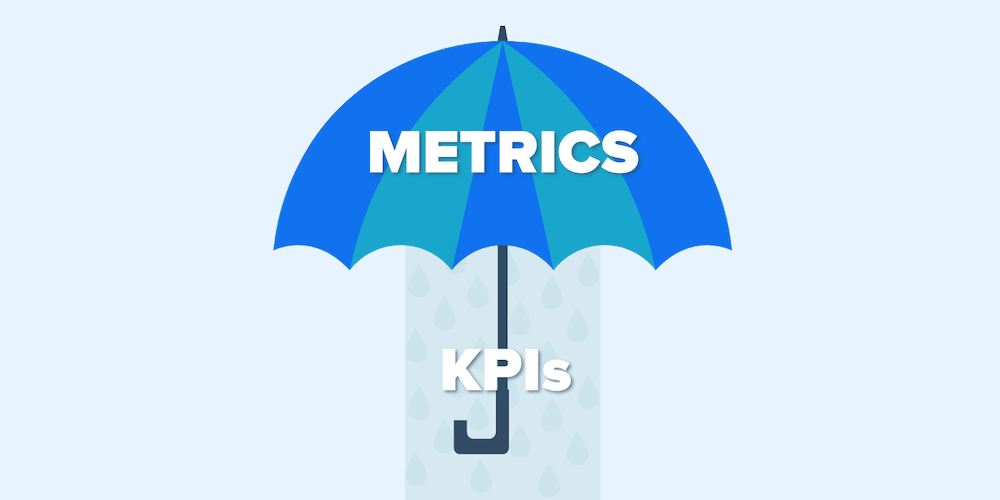
While you may have a stream of metrics to report on, your KPIs should only be chosen based on your business objectives.
Let’s break down what metrics and KPIs mean for WooCommerce businesses.
WooCommerce Metrics
Generally speaking, a metric is a quantitative measure of data.
For WooCommerce businesses specifically, a metric can be used to track the performance of any single aspect of a business.
For example Sales, Conversion Rate, and Average Profit Margin are all numerical figures that give you precise information for one particular business aspect. However, they may not necessarily be KPIs based on your client’s goals.
Key Performance Indicators (KPIs)
KPIs are metrics that are the most insightful markers of overall success depending on your current goals.
Because they directly align with your strategic objectives, you can use KPIs to track your progress toward current or long-term goals, estimate outcomes, and form future strategies.
To select a KPI, filter through your available metrics and decide which ones fall into your current business plan. Because of this alignment with your business’ bottom line, a KPI goes much deeper than a metric to give insight on your business progress.
With KPI, you’ll have the ability to:
- Clearly determine the progress of your goals
- Keep an eye on your successes and milestones in relation to your business goals
- Prioritize the areas you want to see improvement in
It’s important to note that any two businesses may measure the same metrics. However, they may decide on entirely different KPIs in relation to their overall objectives.
Top 13 WooCommerce Metrics and KPIs To Track
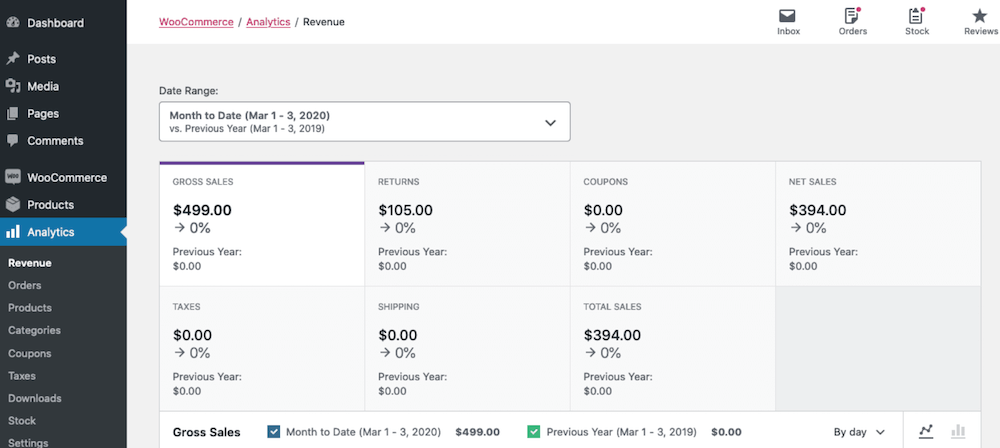
There is helpful basic data presented in the WooCommerce analytics, but in most cases you will need to manually calculate your KPIs (unless of course you choose to use a tool like AgencyAnalytics which will be touched on at the end).
1. Sales
This metric shows how much your client has generated from their website. You’ll also have the option to map it over specific periods (e.g., hourly, daily, quarterly, yearly). Choose the most fitting period to show sales growth based on your client’s goals and timelines.
Here’s a tip – keep tabs on the most popular hourly and daily sales times to pinpoint when to launch a new product. Also, remember to have quarterly and yearly sales metrics as KPIs to guide plans.
2. Conversion Rate
This metric is the percentage of visitors to your client’s website who follow through on an action (such as completing an online transaction) and become customers. While the average conversion rate is only 2-3%, it’s an essential measure of success for an eCommerce business.
Your clients should use this information to improve their digital marketing strategy and drive more qualified traffic to their online store with relevant campaigns.
3. Cost per Acquisition (CPA)
CPA refers to the total cost of acquiring a customer who completes an action.
This metric tracks how effectively a marketing campaign generates revenue, which is especially important for pay-per-click campaigns. The goal is to keep CPA lower than AOV (Average Order Value) to ensure profitability.
4. Number of Transactions
Compare your client’s eCommerce performance with industry peers by tracking the number of transactions.
This KPI measures whether your client is meeting industry benchmarks and may highlight areas for improvement. It also lets you know if your client is on track to hit a revenue goal.
5. Cost of Goods Sold (COGS)
This figure refers to the total amount spent to create an item on your client’s marketplace.
Generally speaking, only direct expenses in the product’s production are included in COGS (such as materials and labor). Other costs, such as sales and marketing efforts or overheads (e.g., renting office space), aren’t included in this calculation.
Here are a few steps to calculate COGS:
Step 1: Calculate (beginning inventory + purchases during the period – ending inventory)
Step 2: Multiply that number by the number of goods sold (which you’ll have to get from your client if you don’t have it on hand)
6. Average Profit Margin
This metric refers to the actual amount your client’s business makes minus any expenses such as COGS, overheads, and taxes.
Here’s a formula to remember:
Average Profit Margin = ((Total Revenue – Expenses) / Total Revenue) * 100
Use this metric to determine the average profit for a specific time (which should be one of your client’s KPIs).
7. Revenue per Visitor (RPV)
RPV estimates the amount of revenue earned each time there’s a visitor to your client’s WooCommerce site.
RPV = Total Revenue ÷ total Site Visitors
For example, say your client made $400,000 in sales last year from their eCommerce website. If there were 40,000 visitors in total, their RPV would be $10.
8. Customer Lifetime Value (CLV)
This metric refers to the lifetime worth of a customer, i.e., how much revenue your client can expect from any given customer throughout their business relationship.
Keeping a customer is easier than getting a new one each time, so your client should maintain a seamless customer journey and track CLV over time.
Here’s how CLV is calculated:
- Determine the parts of your client’s site where customers complete a transaction (e.g., a shopping cart)
- Track customer history and house that customer journey in one place (e.g., enabling customers to create accounts)
- Measure the revenue made throughout their customer journey
- Add this total revenue for each year they’ve remained a customer. Multiply this figure by the duration of their customer journey and minus any related expenses (e.g., customer acquisition cost)
In summary:
CLV = (Customer Revenue per Year x Duration of the Customer Journey) – The Total Cost of Acquiring and Maintaining That Customer
A high CLV means loyal buyers, whereas a low CLV might point to problems with customer satisfaction (e.g., quality control, customer care, or challenging onboarding).
Be sure to explore why a low CLV may happen. Your client might be lacking an active initiative to make customers return, such as email marketing campaigns, loyalty programs, social media engagement, or special offers.
9. Returning Customer Rate
This is a very valuable metric as it is deeply correlated with CLV. Returning customer rate refers to the percentage of customers who have returned and made additional or repeat purchases.
Returning Customer Rate = (Number of Customers Who Shopped More Than Once/ Total Number of Customers) * 100
10. Gross Profit
Gross Profit = Total Sales – Total Cost of Goods Sold (i.e., COGS)
Simply put, this metric is the total profit made in a given period. Keeping track of this figure over time is a useful KPI for eCommerce businesses with a growth objectives.
11. Add to Cart
This metric indicates the percentage of visitors to your client’s WooCommerce site who add at least one product to their shopping cart. Make sure to use the best WooCommerce cart plugin.
The ‘Add to Cart’ metric focuses on your client’s ability to woo prospective buyers successfully and convince them to take an action. It also provides insight user experience, products offered, advertising, and marketing are working together.
12. Shopping Cart Abandonment Rate
Not every visitor that makes a cart in your client’s WooCommerce store ends up completing a purchase. This metric sows you the percentage of shoppers who abandon their cart, which may indicate that some areas need improvement. These may include barriers such as:
- Any bugs in the site before checkout is completed
- Low load times and check out times
- Cumbersome payment methods
For your reference, the average industry rate is 70-75% which you should use to evaluate your client’s performance.
You can also keep an eye on those visitors here who showed interest but didn’t make the purchase.
Here’s how to calculate the shopping cart abandonment rate (as a percentage):
Step 1: Calculate: Total number of completed purchases ÷ total number of shopping carts created)
Step 2: Minus this calculated figure from 1
Step 3: Multiply by 100
13. Net Promoter Score (NPS)
Measuring customer satisfaction in a quantitative way is especially important for eCommerce businesses, which is where NPS comes in.
To gather customer feedback, use a rating system on your client’s website after a customer completes a transaction. You could even track their satisfaction along their journey before a transaction.
Use NPS as a guiding tool to refine the customer experience consistently.
How to Determine Which Metrics to Use as KPIs?
Your client’s WooCommerce store objectives will tell you which KPIs to track. Is the goal to win 100 customers by the end of the month? Is it to increase gross profit by 5-10% by next year?
Whatever the case may be, you’ll get to the bottom of your client’s core objectives by listening closely and understanding what role your agency plays in achieving them.
Choose and Track KPIs
Regardless of which KPIs you recommend and monitor, be sure to have them readily available and easily accessible. That way, your clients can access their data whenever needed.
3 Types of KPI Reports You Should Know About
Here are three types of KPI reports that your agency should consider using based on client needs.
1. Analytical KPI Reports
These reports are used to thoroughly detail your client’s KPIs, which are significant measures of success for any WooCommerce business.
Analytical KPI reports give in-depth insights into KPI data’s specific rises and dips. You can even make interactive analytical reports enabling clients to evaluate live data more dynamically.
2. Operational KPI Reports
An operational KPI report helps monitor the everyday activities of a WooCommerce site, which can be used to make critical decisions and improvements.
For instance, a campaign manager may choose to improve a website’s loading time based on key findings from an operational KPI report.
3. Strategic KPI Reports
With this report, you can get a solid picture of the business’ health. Strategic KPI reports monitor the course a business is taking and helps to develop new strategies.
It also tells investors and owners how your business is performing in the light of set goals and benchmarks.
Using AgencyAnalytics to Create Reports for Your Clients
WooCommerce offers its own analytics dashboard that tracks total sales, top products sold, and so on. But it becomes a mammoth task to manually keep track of all that data while running multitudes of WooCommerce stores for your clients.
What if you could manage multiple client data on one platform, and have white-labeled, automated reports at the click of a button? It’s possible with AgencyAnalytics– here are the best two options to consider:
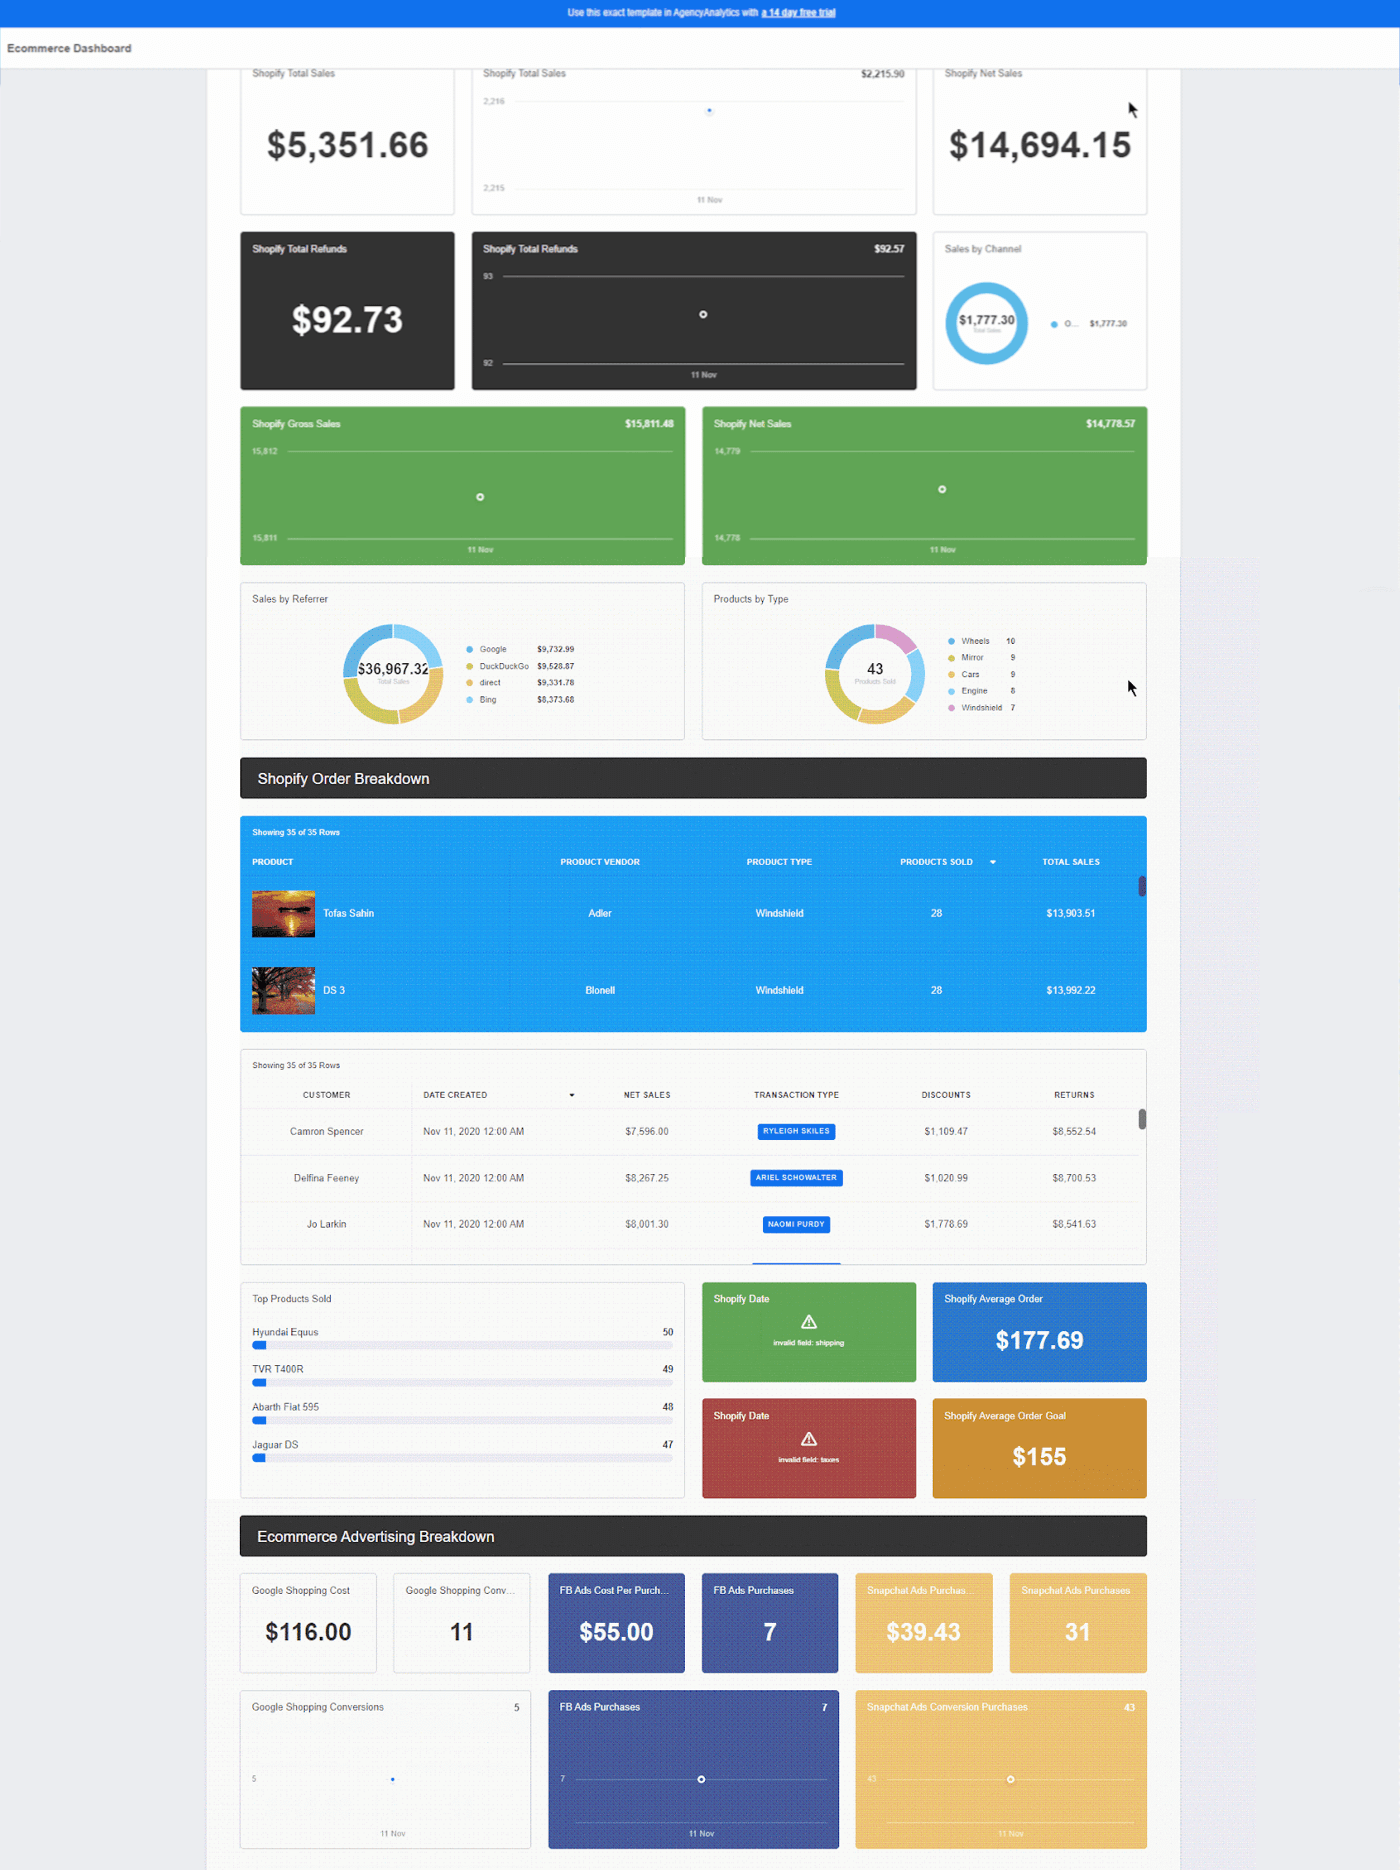
1. Create a fully customizable eCommerce dashboard if you’re also tracking other metrics (e.g., data from Stripe or Google Analytics).
After you’ve connected your eCommerce accounts to AgencyAnalytics, creating a dashboard is as easy as dragging and dropping widgets. The major advantage is that your data automatically updates, which means you won’t have to worry about manually pulling information.
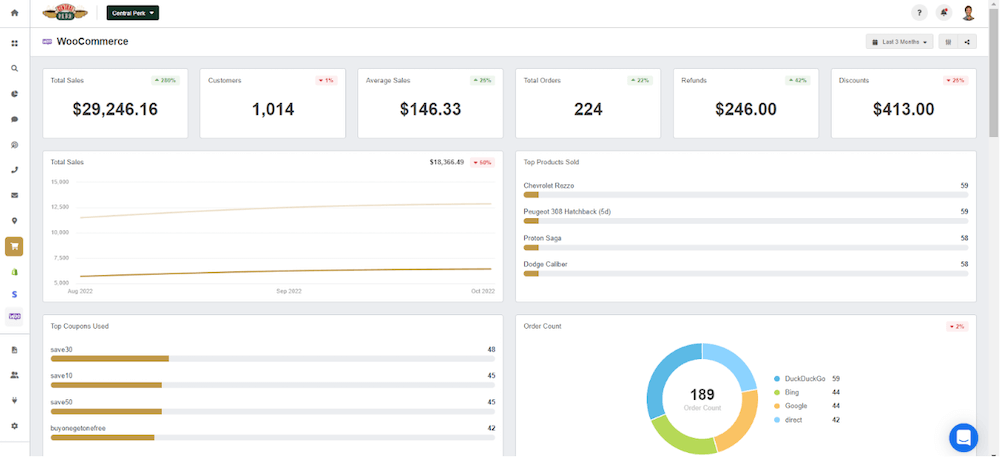
2. Use a pre-built WooCommerce dashboard to save time and streamline your eCommerce efforts in one place.
No need to reinvent the wheel – simply connect your WooCommerce account to AgencyAnalytics and get access to your real-time, visually appealing data whenever you need it.
How AgencyAnalytics Makes WooCommerce Reporting Easy
In summary, here’s how AgencyAnalytics can help you streamline your clients’ WooCommerce efforts:
- Automated WooCommerce Reports are presentation-ready in seconds and can be sent to clients on a reporting schedule or at the click of a button
- Fully Customizable WooCommerce Dashboards let you control exactly what each user sees. Give your clients easy-to-digest dashboards showing their eCommerce, web traffic, social media, and more!
- The SEO Site Audit Tool lets you track accurate keyword rankings for clients and tweak their eCommerce strategy accordingly
- Unlimited Staff & Clients Accounts enable your entire team to log in and monitor WooCommerce performance
- White Labeling allows you to integrate branding (such as custom colors and logos) and send automated emails from your agency’s email address. You can also brand a mobile interface, which functions as your own app
- Mobile Updates can be sent to your clients to track their store on the go
- Manage Multiple Clients and access data for each client in a single holistic platform! Switch between multiple stores in an instant.
Save time and connect data from multiple clients with 70+ integrations, powerful SEO tools, and unlimited reports. Try AgencyAnalytics free for 14 days.
WooCommerce is a dynamic platform that lets you keep on top of your game. From facilitating online transactions to providing a seamless customer experience, it’s a definite game changer for any eCommerce business.
To make improvements and see what’s working best, be sure to track the WooCommerce metrics we’ve outlined and decide on relevant business KPIs. Go a step further by consolidating your data into a KPI report and using a dynamic reporting tool like AgencyAnalytics to streamline the entire process.
After you’ve put the necessary measures in place, you’ll be in a better position to grow your eCommerce business and reach your goals.