15+ Best WordPress Plugins for Data Visualization


Data Visualization is a way of visually representing data. You may be more familiar with this practice than you think. Common formats include infographics, charts, tables, and even maps. Data visualization is also a crucial part of modern Business Intelligence(BI) and advanced analytics. It provides a quick way for readers to interpret trends, recognize patterns and otherwise understand information at a glance.
Confused about how to do this exactly? Remember that you are in the 21st century and using WordPress. Lucky you – it’s pretty easy to find WordPress add ons or tools for everything. Certainly, there are quite a few for data visualization as well. Below we have listed some of the best data visualization WordPress plugins you can use to easily organize and display information on your site.
1. POWr Graph

POWr Graph is a WordPress plugin which allows you to create and embed graph to represent data flawlessly.
This free plugin doesn’t demand any knowledge in the code to access. It’s super easy to edit. POWr plugin also supports multiple chart types and comes with interactive controls which makes it user-friendly. Other features include:
- Easy customization
- Mobile Responsive
- Customizable styles
- 10×10 data fields
2. Google Chart
Yeah, sure! Google ensures its presence everywhere – including WordPress data visualization. The WP Datatables plugin includes a Google chart function to help you represent your data with attractive and interactive charts and tools.
Google chart is a free plugin which is easy to use and powerful. It provides an elite experience for users with a vast variety of charts, including tree map and scatter chart. Some of the features include:
- Customizable charts
- Interactive Dashboard
- Cross-browser Compatibility
- Energetic Data
3. Tablepress

TablePress facilitates table creation and management on your WordPress site. HTML knowledge is not mandatory as it facilitates easy edits through a user-friendly platform. Even formulas can be added to the tables with the help of TablePress. Also, features like pagination, sorting, and filtering are made possible here. Additional features include:
- An interactive Dashboard
- Template tag function
- Preview available
4. Snowball
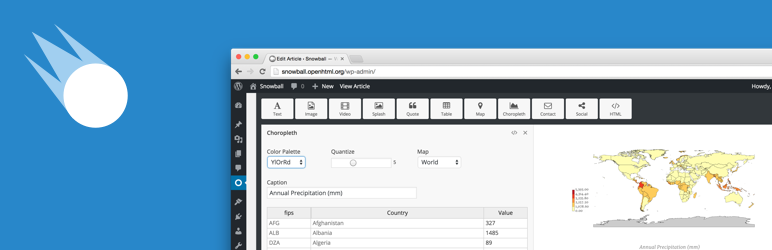
Snowball is a WordPress plugin which makes your articles attractive and engaging. It is easy to use and a wonderful tool you can utilize to create unique articles. The plugin includes easy blocks you can add to posts for side notes, tables, image comparisons, videos, bar graphs, table of contents and more.
Features at a glance:
- User-friendly interface
- Supports a variety of content including text, videos, images, data visualization, and interactive widgets
- Can edit the code to meet your needs
5. Infogram
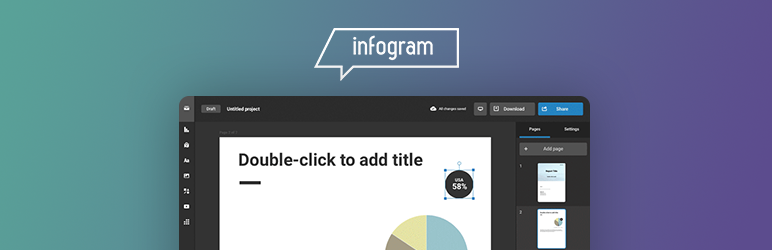
Infogram plugin will allow you to embed infographics and charts into your WordPress posts and pages. Add interactive pie charts, line charts and bar charts and more. Or even design your own word clouds and infographics to make the data even more engaging.
Perks of using Infogram:
- 550+ maps and 35+ charts
- One million+ icons and images
- Easy editor
- Interactive reports
- Data importing made easy
6. DW Chart
DW Chart is a premium plugin in WordPress which will allow you to create charts for your WordPress website.
The plugin is fully responsive and includes options to insert charts visually through the admin panel. The plugin also provides a variety of chart types to integrate the data to make it visually engaging and simple. Features can be listed as:
- 10+ chart types like Bar, Column, Geo, Pie, etc.
- Highly customizable
- Engages Google visualization API
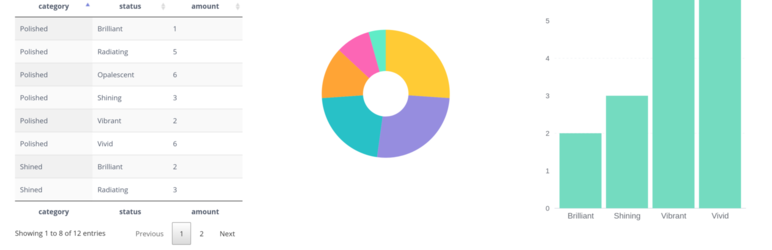
7. wpDataTables
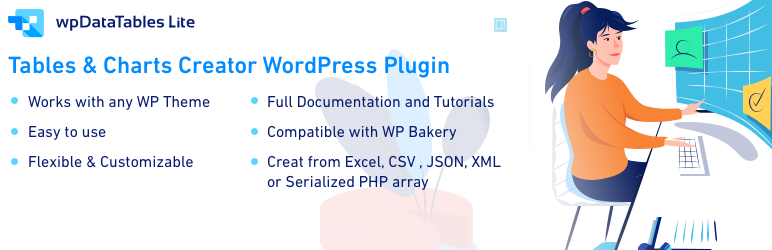
wpDataTables is a plugin which is used by millions to make the raw data more appealing and easily understandable. It promises to make your work with charts, tables, and data hassle-free.
Creating tables in wpDataTables is done in three simple steps:
- Provide data
- Customize the table
- Introduce in the desired space
Some of the features which wpDataTables display are:
- Responsive Design
- Large Table Sizes
- Advanced Filters and Search
- Editable
- Highlighting Possible
Plus there is a pro version you can upgrade to for even more features.
8. Visualizer
Visualizer is another great WordPress plugin to create interactive and responsive charts and graphs for WordPress into your WordPress pages and posts. The visualizer plugin is built on Datatables.net and the Google Visualization API. With the help of these resources, it’s easy to create and embed your own custom charts and graphs. This plugin also supports cross-platform portability to new releases of Android and iOS. Some of the features of Visualizer pro include:
- Create private charts
- Import data from other charts
- Support and updates for 1 year
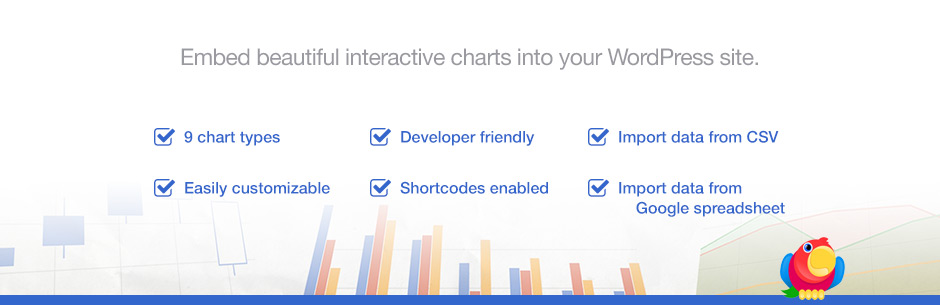
9. Visualizer Pro

Visualizer Pro is a great plugin that adds awesome charts and graphs to your posts. Stats may not be loved by the users if they are not put in interactive visual ways. This is where Visualizer plugin comes into play.
With this plugin, you can add 9 different types of animated charts and import your data from either a CSV file or from Google Docs. It’s that simple.
The charts can be customized in many different ways, in a Live Editor, so you can see the changes live in the browser. You can select the chart’s size, color, border, text, background, legend, layout, and many other small details.
Visualizer Pro generates a unique shortcode for each chart you create, and you can use in any post or page you want. Besides, there’s an archive with all the charts that you created during all this time, so nothing will ever be lost and you can come back to an old chart if you want to use it again. With Visualizer Pro, your statistics won’t look boring again.
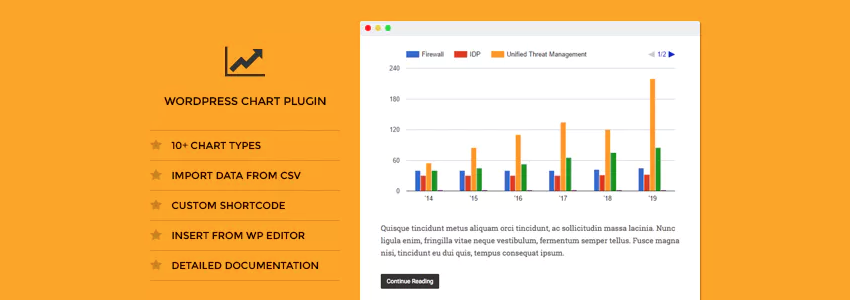
10. WordPress Charts
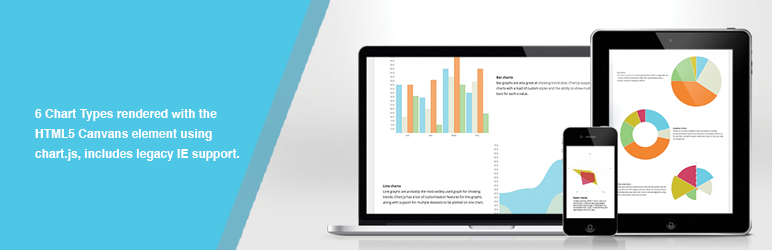
WordPress charts is a plugin known for its clean designs and colorful elements. WordPress charts come with a variety of six chart types and is a flexible and lightweight plugin.
The plugin incorporates chart.js script which uses html5 canvas element. The charts let you customize them to look great even on retina displays.
11. WP Business Intelligence Lite
WP Business Intelligence Lite is a plugin which will render your website a visually appealing outlook. Embed the plugin in your websites to add charts or another element which will visually enhance the data.
Some features include:
- Responsive Charts
- Works in Chrome, Firefox, IE9+
- Live connection
12. UberChart
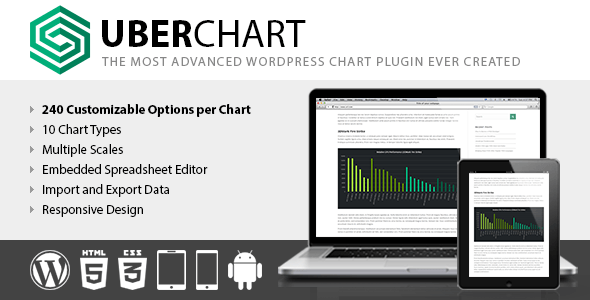
If you want a visually stunning solution for adding data to blog posts, UberCharts is great value. And if you’re still not convinced, here are a few more screenshots of the charts in action. The plugin offers an abundance of chart types – ten to be exact, including line charts, bar charts, and pie charts.
However, the plugin’s biggest selling point is the huge number of customization options it boasts – 240 customization options per chart. You can configure your chart’s color, font style, responsiveness, and animations, allowing you to create super-stylish charts for instant visual enhancement to your blog posts. From a data perspective, you also have full control over your axis and scales.
It’s simple to configure the charts, too. UberChart offers a back-end spreadsheet editor, plus you can upload data directly from Excel, Open Office, or Google Spreadsheets.
UberChart is a powerful WordPress plugin which allows you to customize charts for your WordPress website. Choose from responsive chart types with 240 customizable options for visualization. Some features include:
- 10 different data types
- Spreadsheet editor
- Extremely customizable
13. iList Pro Infographic Maker
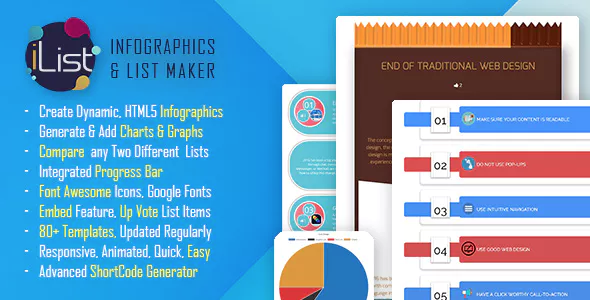
iList is a dynamic WordPress plugin that allows users to make helpful graphics for their website. Create infographics and represent your data effortlessly in an easy to understand infographic. Some of the features which will make you fall in love with this plugin are listed below:
- A powerful short-code generator
- 80+ Templates
- 800+ Google fonts
- Simple admin area
14. Responsive Charts
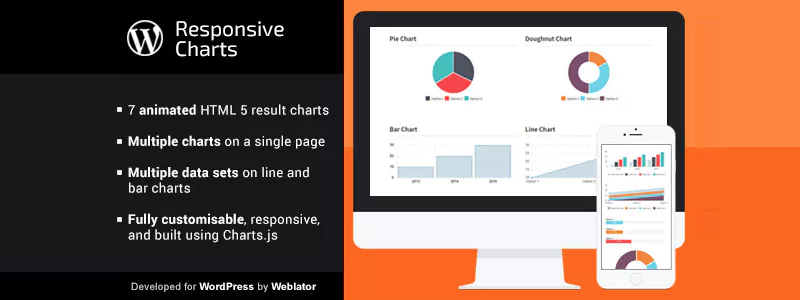
Responsive Charts is yet another plugin you can use to create HTML 5 animated charts in WordPress. Adding a neatly formatted chart on your website to represent your data will make it presentable and simple to understand at a glance. Another feature is the option to use multiple charts on the same page. Let’s go through some of the features:
- Presents 7different animated chart types like pie charts, bar charts, line charts, etc
- Fully customizable charts and tools
- Highly responsive
15. WPBakery Page Builder

WPBakery page builder is a fast and easy to use tool. It equips the user with nearly unlimited design options to create custom, responsive website layouts. WPBakery is the best WordPress plugin to display your complex data in ways the viewers will admire what they see even if you are illiterate in coding. Built-in page elements for graphs, charts and galleries are just a few of the features:
- 50+ Premium content elements
- SEO friendly page building tool
- Plenty of predefined layouts
- 40+ unique grid design templates
16. JetElements for Elementor

jetElements is an extension for the Elementor page builder. The plugin adds tons of elements, including pie chart and table modules for the popular page builder. These are great tools that you can insert into any custom page layout to display your data. Want to know more? JetElements ships with:
- A huge set of 50 content widgets
- 150+ subpage templates
- 60+ home pages
Data visualization is not only useful for your website. Even mobile apps use them to ensure readers can easily view and understand information. Since the digital world is driven forward by data, it is important that you represent it with utmost care and perfection.
The above-listed plugins will certainly change the way you have represented your data up until now. The tools provide an easy way to make raw data interesting and visually enticing. Publishing detailed data and analytics is great. But you have to make sure that the effort you put in doesn’t go unnoticed. Give your data a quick makeover with any of the above plugins and project it beautifully to the world. And if you think we’ve missed a helpful tool or plugin, be sure to share it in the comments section.