WordPress Performance Testing: Why, How & Which Tools to Use

Tons of articles written as the one guide to performance on WordPress, tons of content dedicated to the subject at hand but, what about the tools we use for measurement?
The online and software tools we use are a big part of the equation. A wrong tool or improper results can lead you astray. Today we are going to do the exact opposite, today we are going to benchmark the benchmarks and see if we can come up with a better idea of what’s good, what’s acceptable and what should be definitely avoided when trying to analyze our sites in our need for speed.
The stars of the night are going to be: GTMetrix, KeyCDN Speed Test, Pingdom Tools, Google Pagespeed Insights, Webpagetest and Monitis Speed Tools. we will talk about the strong and week points on each and then offer you the results.
For Techno Geeks
For this article we are going to use a website and a service we are sure it’s suited for optimum performance. The site will be a digital gaming magazine, highly optimized, with tons of articles. The site is using minified CSS, static HTML cache, minified JS, a CDN and is running under HTTP/2. On the server side it is running on a Xeon processor, 24 threads, 24GB of RAM, a Gigabit connection and it’s hosted on a datacenter in North Carolina, the amount of request the server has is minimal and it is highly under-used, processor usage is well beyond 0.5 for a total count of 12 cores and 24 threads, nginx is loaded up with cache and is running under PHP 7.1 RC
Testing WordPress Performance Tools
All of that techno-babble means is that it’s one powerful server hosted inside a trusted datacenter running an optimal web server and website. Remember, this article is about benchmarking the benchmarks, for that purpose we will select the closest server to our origin, which is New York and Dallas as we don’t want to take into consideration network speed but benchmark accuracy. All the online tools allowed us to select Dallas/New York except webpagetest which is always running over-capacity on New York forcing us to go to California EC2 for the tests.
We are going to measure load time according to each tool and then we will offer you a final table of comparison between them, the point of this article is to see the variations in testing and determine which one is the most precise, fast and easy to use to merit a recommendation. The point of this article is also to show you why some test are totally useless even coming from big stars like Google.
We will run the tests 3 times on each service. Without further ado, let’s see how they respond to the tests.
Test 1: GTMetrix
GTMetrix is a fine benchmarking tool with a very well crafted interface that will allow you to not only see the load time but to get details on Google Pagespeed score and Yahoo’s YSlow. After the benchmark is finished it will also show you a list of items that GTMetrix considers in need of a fix.

It is important to note that GTMetrix does tend to use the Canadian server as the starting point, which is not what we want so you’re better off registering to GTMetrix. When registering it will allow you to change the test URL, the browser and the kind of connection.
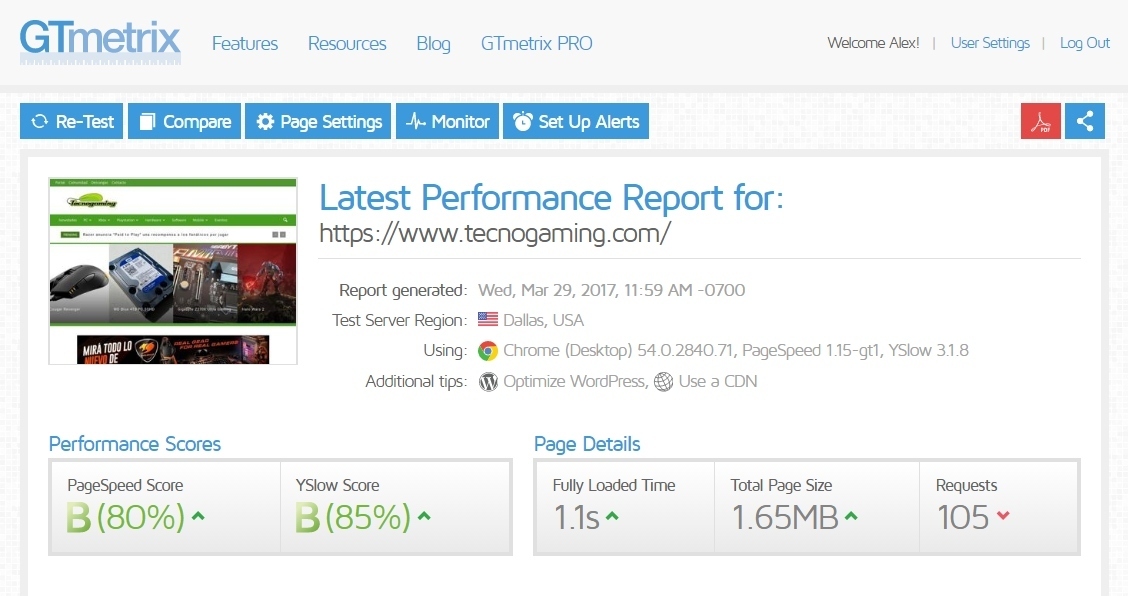
The first run gave us a score of B and B for both Google Pagespeed and Yslow, this is not something we care too much about as you’ll see later on the Pagespeed Insights. The actual time it took to load was 3.3s the first run, 4.0 seconds the second one and 1.1s for the last run. The variation is pretty high, in fact, it’s 2.9 seconds! On top of that, we were monitoring the load on our own server when the test was conducted and we confirm it was well under 0.5 which clearly shows the variation is coming strictly from GTMetrix and network, not from the server side.
GTMetrix does not give consistent results in the load time, period.
This is a problem, for GTMetrix to be a trustworthy tool it must give a more precise score. You’ll see that we got much better results with other tools. GTMetrix measures the full loaded time not the partial time it takes to start showing up the website. As our site uses image lazy loading, it’s not a fair representation of what a user will expect when the website opens, even more so, the huge variation from 4 seconds to 1.1s means it can’t properly identify what is happening.
We wanted to be sure it was not our fault so we run another set of tests and we got 3.7s, 1.2s and 5s which is still, very chaotic. GTMetrix remains then as a good alternative to identify potential optimizations but you should not trust the actual load time it gives.
Test 2: KeyCDN Speed Test
KeyCDN Speed Test is a simply tool that will show you the asset loading and total time it took for the website to finish. We selected Dallas as the source server and gave it a go.
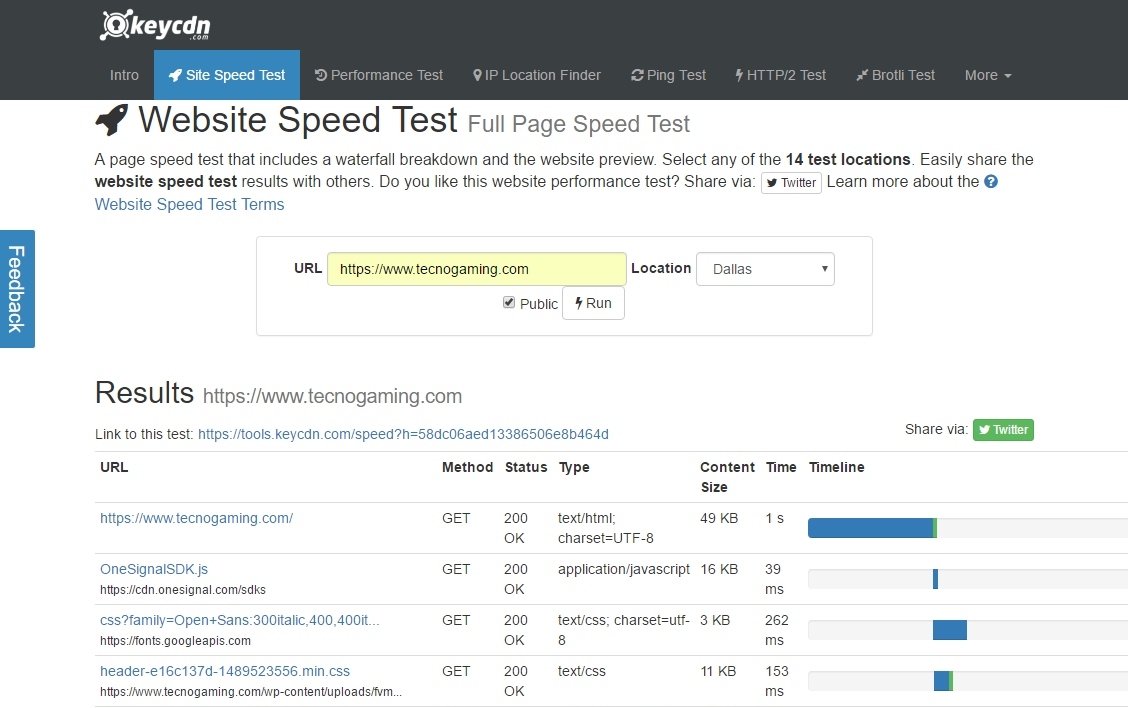
This is the representation of the asset loading and the time it takes for each part to load.
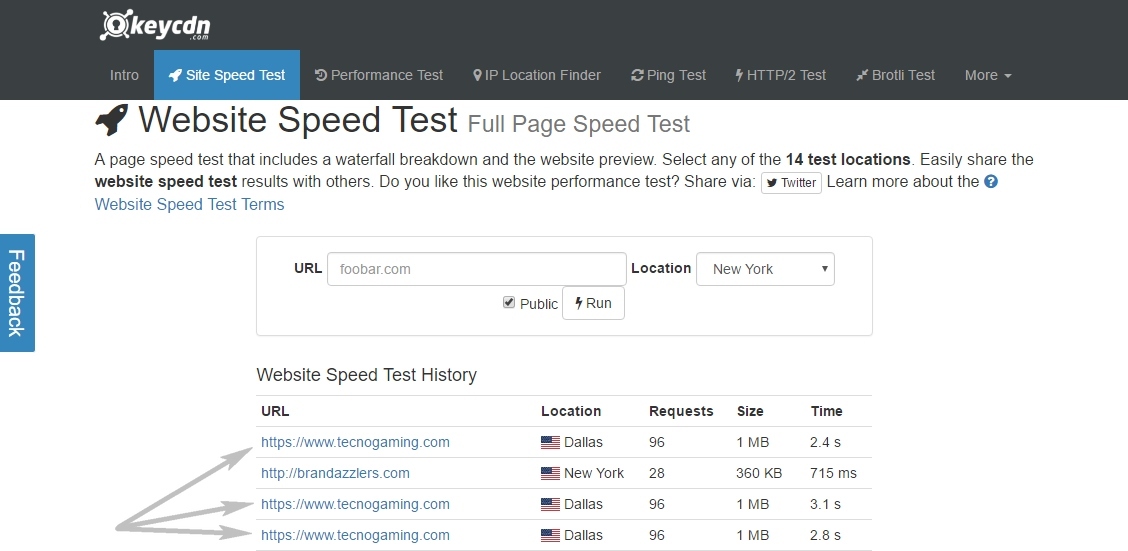
You can see by the results that the total time it took was 2.4s, 3.1s and 2.8s well within the range of 2.4s to 3.1s that’s a variation of 0.7s between worst/best score. Right off the bat this test is much more trustworthy than GTMetrix on the actual load time and a much better tool for quick testing a site. It does not include all the tools GTMetrix has for optimizing the site but, for experienced users, a much better tool since the tests are faster and more precise. It is a very simple tool that seems to work.
Test 3: Pingdom Tools
Pingdom Tools is one of the most well known benchmarking tools and you’ll soon find out why. Let’s test it and see what happens.
The first run offer us a total load time of 2.22s, the second run a result of 1.86s and the third one 1.85s ! You can clearly see how precise this test is when you can almost replicate a test and get almost identical results, a variation of less than 1 second from 2.22 to 1.86s that’s 0.37s variation! The benchmark tool also provide useful information, like good information on what should improve and a nice and very detailed log of assets. You can even monitor each asset load time and check the FTTB (First time to byte), not available on the other tests.
Test 4: Google Pagespeed Insights
Pagespeed Insights is the Google Tool for speed optimization, after a 3-run this is what we got.
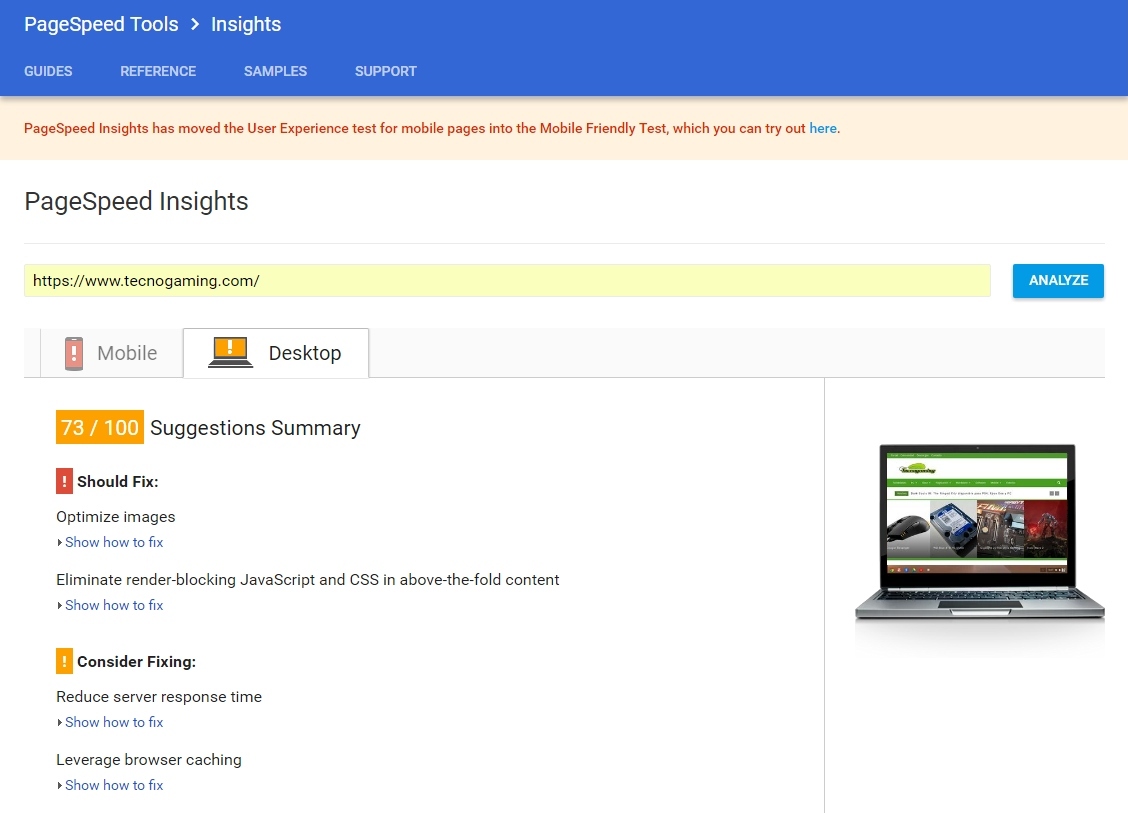
So.. no load time?, no first time to byte information?, no assets loading tree? and what about the score? How can it be that our site is so horribly bad for mobiles when the actual new mobile test tool from Google shows us a Green Status
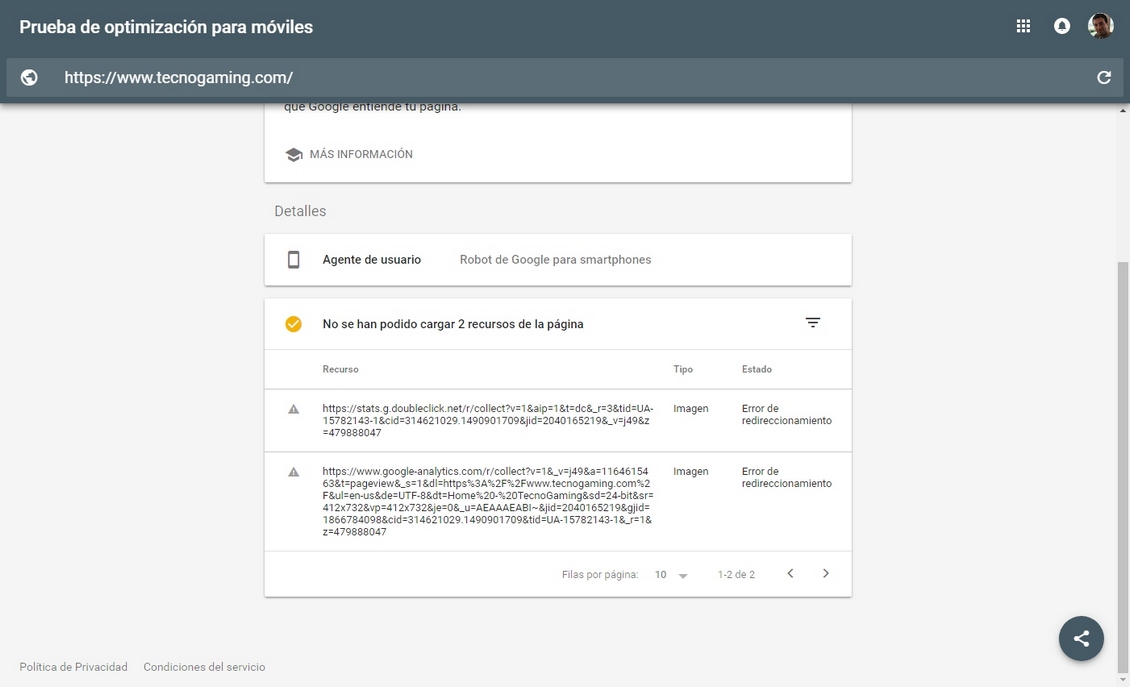
This is a result from Google’s new Mobile Test Tool. They even have the nerve to say “there were some assets loading error” but guess what? The error comes from the Google Analytics library!
So, in other words. Google Pagespeed Insights doesn’t provide any speed result whatsoever, instead it throws you a list of things you should improve and then on top of that throws you a score you have no idea how it came to be that even contradicts it’s own tool for Mobile Test.
The explanation is simple. Google Pagespeed Insight is totally and utterly useless. The score it throws is built upon the “things google believes you should be optimizing” and not based on actual speeds of the site.
Our advice is to never use Google Pagespeed for anything speed related, optimizing for a tool that contradicts with other tools from the same company is like trying to shoot a flying ball in the sky, at night, blind and with a lot of wind.
Test 5: WebPageTest
Webpagetest is another handy tool similar to GTMetrix.
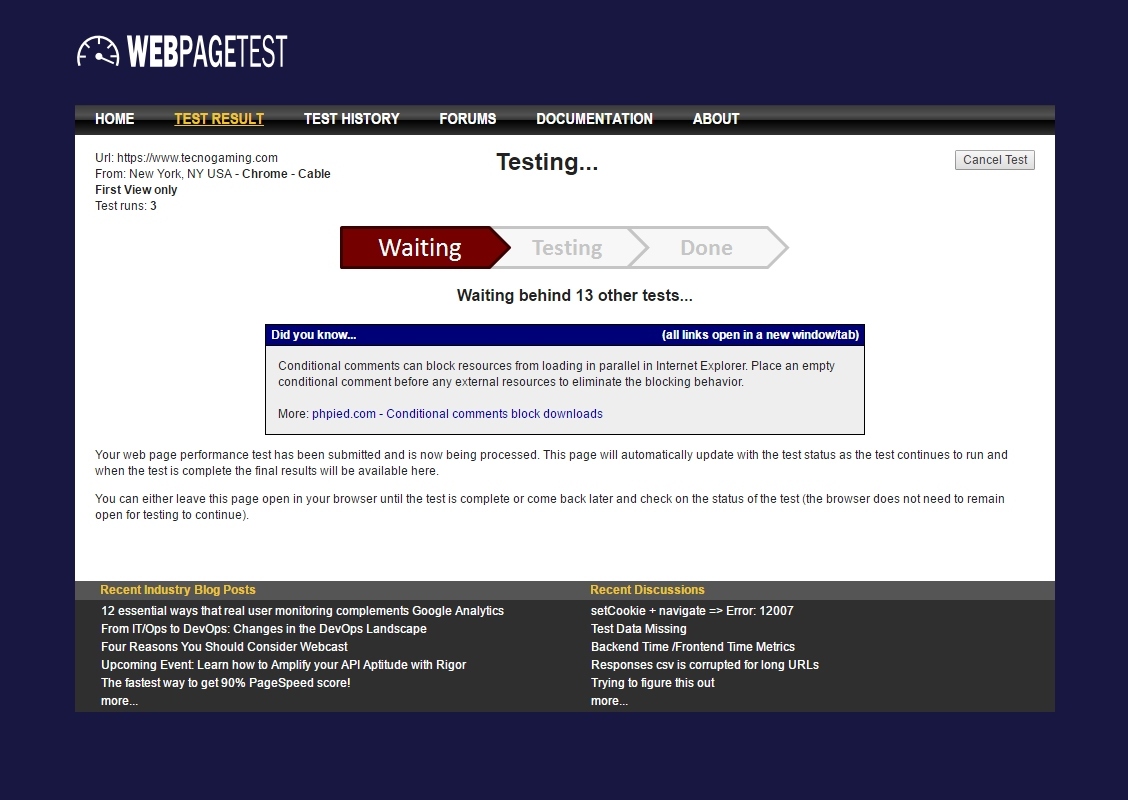
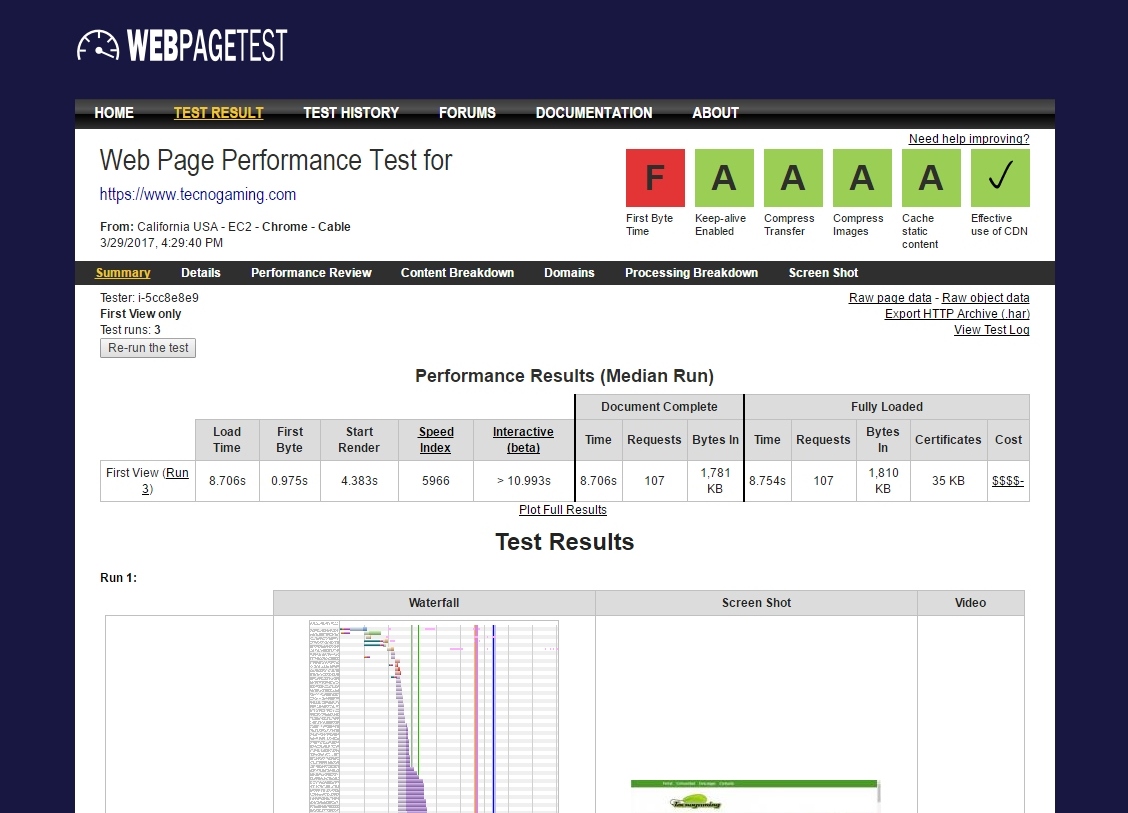
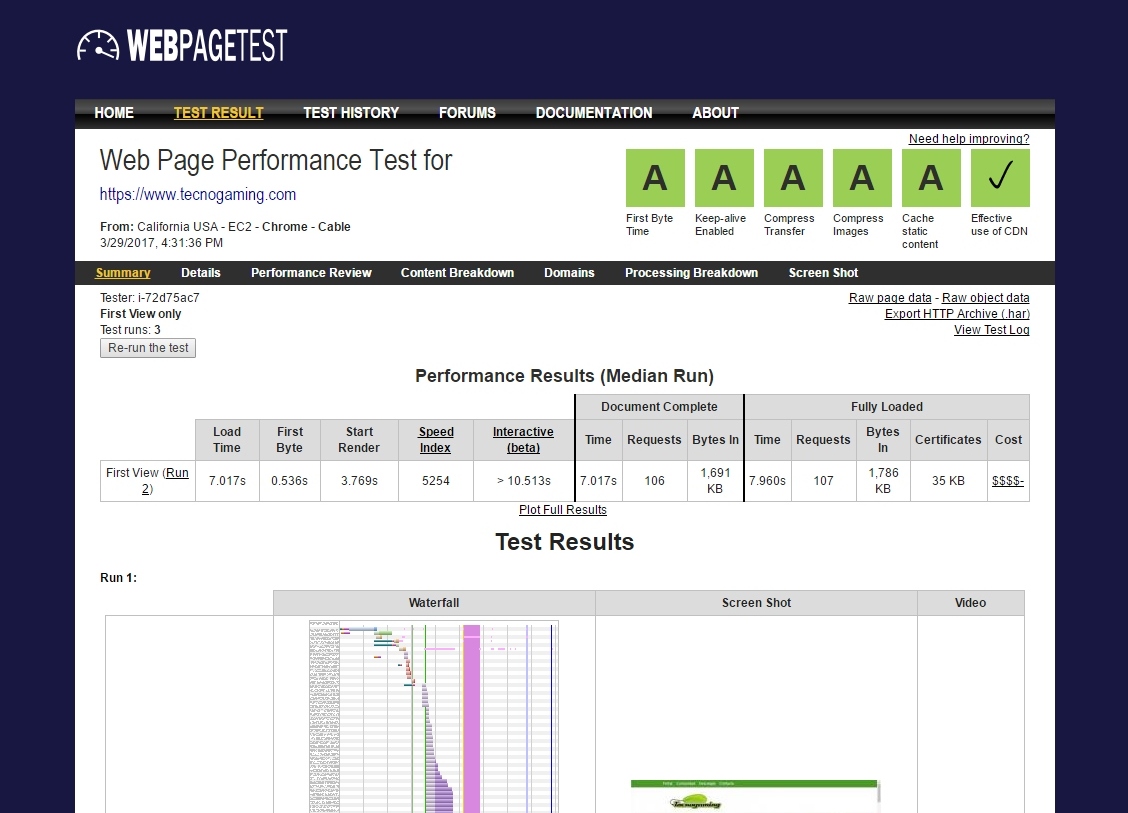
The first thing we noticed on webpagetest is that their New York server are really over-capacity. After 40 minutes of waiting in line we had to change the servers to California EC2. As you can see from the results, we weren’t impressed.
First it throws a document complete in 8.7s, the second run at 7.0s and third at 8.0s that’s a 1 second variation, higher than KeyCDN Speed Test variation of 0.7s with 3 times more wait time. The assets loading is very chaotic, sometimes it shows very high first time to byte scores while others shows better scores. Pingdom Tools reports less than 0.6s for first time to byte while webpagetest says we are almost at the 1s wait time! The scores are weird too. The first score throws you an F like in you suck for First time to byte. This is with a server that was benchmarked against WPEngine servers and run toe to toe. The second test throw us an A like in you really rock but the third test confirm that indeed we suck.
The main problem webpagetest seems to be having is the servers they are using, which seems congested.
Do not use webpagetest if you care about consistent results, their grade letters are chaotic to say the least and don’t seem to represent actual performance figures, in fact, we are more inclined to believe that they are running through a high congested network that is adding latency to the tests.
Test 6: Monitis Speed Tools
Monitis is another benchmark tool similar to Pingdom Tools with a detailed response time from each asset.
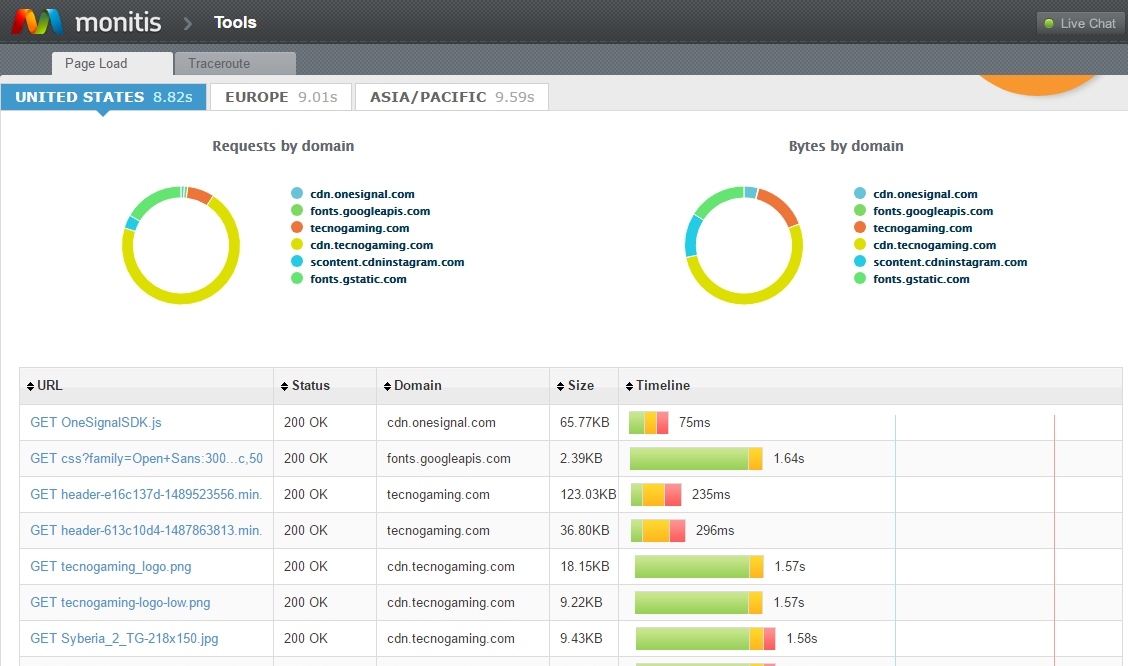
Problem with Monitis is two-fold. On the one side it gives the total load time instead of the actual time it takes the site to display, that means it’s negating the impact on lazy loading. The second problem is that they cache the result for a very long time, making the re-testing impossible.
Monitis does not seem to be a precise test, we run 2 more test with several hours apart and we’ve got 12s for the second test and 7 seconds for the third one. That kind of variation can’t even compete with GTMetrix.
The Results
So, here is a complete list of results from all the benchmark tools in one nice graph.
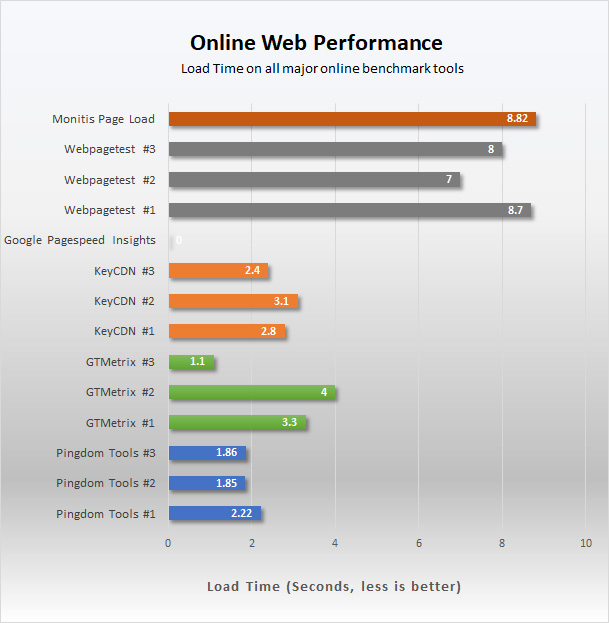
The results pretty much shows who’s the winner in the timing department. But, we think one more graph should clear things up for you even more.
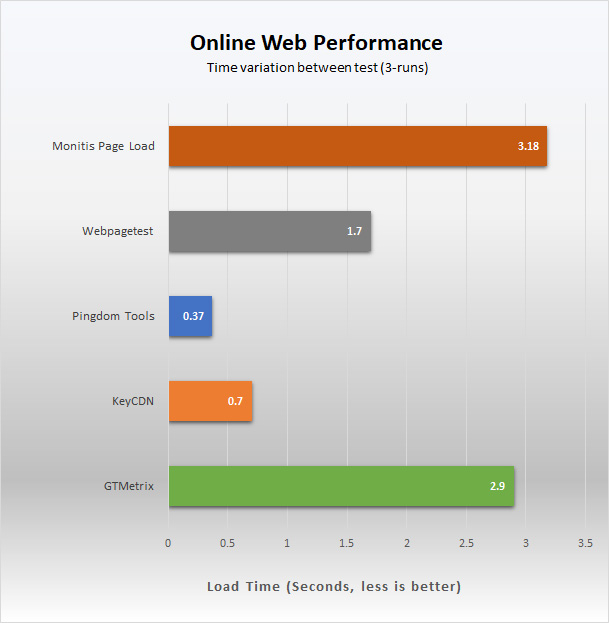
By doing a time difference between the best and the worst value on all of the benchmark tools the comparison is even more grotesque. Pingdom Tools wipes the floor with everything else in terms of precision by giving a variation of less than 0.37s, the only one that comes close is KeyCDN Speed Test with 0.7s. Webpagetest does have something going on with a 1.7s variation and GTMetrix and Monitis are way outside of the equation with almost 3 seconds variation between runs.
And the Winner Is…
Pingdom Tools! If you care about performance, there is no other test that can give you such a precise and fast result. It’s not only the more trustworthy test of them all, it’s the fastest between runs. By the time GTMetrix does a single run you can do 4 runs of Pingdom Tools. If GTMetrix or webpagetest takes so long to complete, why do both tests have so many problems rating the actual load time?
We can do a local linux test with several hundreds of connections to our website only to confirm what Pingdom Tools is saying. If you need to do more tests you can use KeyCDN Speed Test which is pretty good and decent but all the other tools are more design/fix oriented than performance tools. If you care about good results, Pingdom Tools seems to be the safest bet.
Have any more WordPress performance testing tools that you’d recommend? Share it below! Or do you have a question about the tests that we ran? Feel free to ask and we’ll do our best to give you a great answer.







Great comparisons. I use Gtmetrix for advanced tests. For basic stuff, I have been using WordPress Inspector. The good thing I like about it is the plugin check.
Check it out at http://wordpress.inspector.io – I usually get a 80ish score.
Still not much of fan for using Pingdom, over KeyCDN or WebPageTest for synthetic site performance testing.
most of time I use pagespeed insights, and Pingdom. Sometimes they are showing different result , but its works fine, if you try again and clear your browser history. keep sharing.
I never bother using Google PageSpeed for benchmarking.
I agree with you that some of the servers WebPage Test uses are congested. But, if you use one of the less congested ones and set up for at least 3 concurrent tests, I think it tends to give more accurate results than any of the testers that run just 1 test. It also picks up more requests than most of them. That’s especially true on sites that run ads.
I have found Pingdom to be the least accurate of them all. The fact that it is so out of line with all other testers should make that clear. Not sure how you concluded it was the best based on its speed result.
Agree that Google PageSpeed is the least helpful of all of them. And now with their heavy emphasis on AMP and lossless compression for images, few sites can get a decent score on the mobile tab. They dropped the scores 15-20 points each for both of those things.
I use pingdom most of the time..also sucuri launched a web testing platform similar to this to test load speed across several countries. have you tried that out?
my 2 cents:
AFAIK
The great Pingdom Tools are using internally the Google PageSpeed Optimization C++ Library (PSOL).